Power BI Dashboard Architecture: From Raw Data to Governed Business Insights
Power BI Dashboard Architecture: From Raw Data to Governed Business Insights
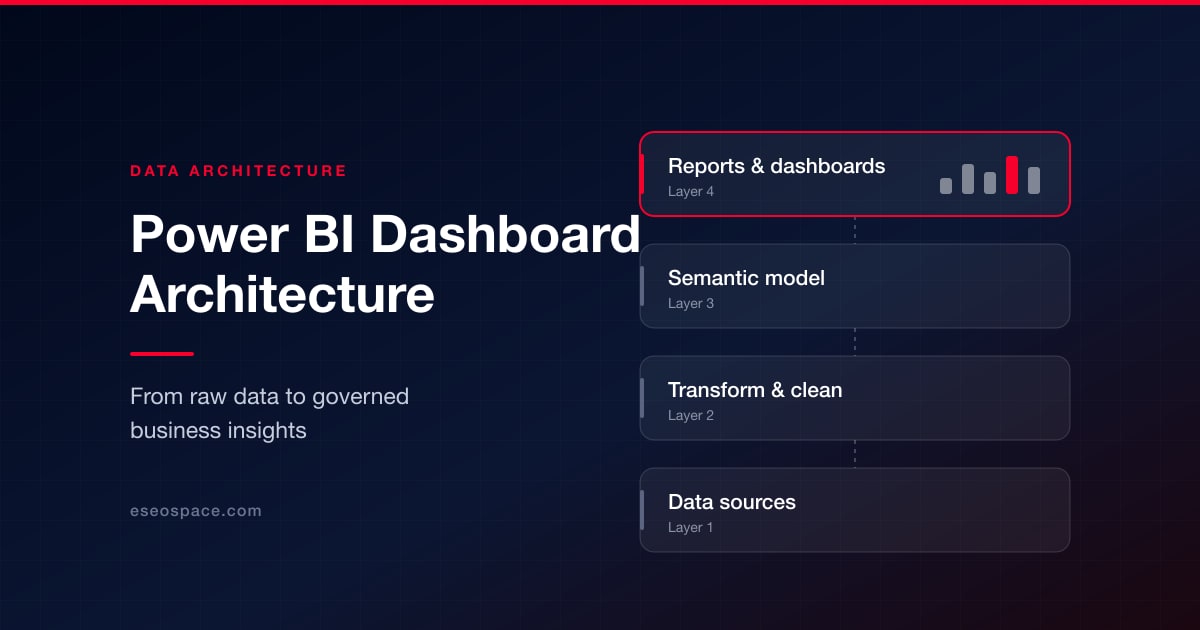
A Power BI dashboard is only the visible part of a much larger reporting system. Behind every chart sits a chain of data sources, transformation steps, semantic models, security rules, and publishing processes.
Weak architecture can create slow reports, conflicting metrics, failed refreshes, and security problems. These issues become harder to fix as more departments begin using the same data. Working with an experienced Power BI Consultant in Chicago can help businesses design a scalable architecture and avoid costly reporting issues as data usage grows.
A strong architecture connects every reporting layer through clear standards. It turns raw data into trusted insights that users can access without questioning accuracy or ownership.
Understand the Complete Power BI Dashboard Architecture
A typical Power BI dashboard example may show revenue, customer growth, operational costs, and regional performance on one page. However, the dashboard depends on several technical layers working correctly behind the visuals.
The architecture begins with source systems such as databases, spreadsheets, cloud platforms, and business applications, which is why the underlying database design and development matters as much as the visuals on top of it. Data then moves through ingestion and transformation processes before reaching the semantic model. Each step must protect data quality and maintain clear business definitions.
The semantic model connects prepared data through relationships, measures, and security rules. Reports use this model to answer specific business questions, the same discipline that turns raw numbers into usable insights and analytics. Dashboards and apps then provide controlled access to approved insights.
Governance surrounds the complete architecture rather than sitting at the final stage. It defines who owns the data, who can publish reports, and which metrics are trusted. Governance also controls how long reports remain active.
Monitoring connects the architecture to ongoing maintenance. Administrators need to track refresh failures, slow queries, unused content, and permission changes. Without monitoring, small issues can remain hidden until users lose trust.
A well-planned architecture should also support future growth. New data sources, users, and reporting requirements should fit without rebuilding the entire system. This flexibility reduces technical work as Power BI adoption expands.
Build a Reliable Data Source and Ingestion Layer
The source and ingestion layer determines what data enters the reporting system and how often it arrives. Reliable ingestion prevents incomplete records, delayed updates, and unexpected changes from reaching business users.
Identify Trusted Data Sources
Teams should document every database, file, API, and business system connected to Power BI. Each source needs an owner who can explain its structure and update schedule. Unmanaged spreadsheets should not become official reporting sources without review.
Select the Right Connection Method
Import mode works well when reports need fast interactions and scheduled data updates. DirectQuery may suit large or frequently changing datasets that must remain in the source system. Dataflows and lakehouses can prepare shared data before several reports use it.
Control Data Refreshes
Refresh schedules should match how often business data actually changes. Critical reports may need several updates each day, while monthly reports need fewer refreshes. Teams should also plan for source downtime and failed refresh attempts.
Clean and Prepare Data Before Modeling
Raw data often contains duplicate records, missing fields, inconsistent labels, and unused columns. The transformation layer should fix these problems before report developers create calculations.
- Remove duplicate records using clear business keys rather than row positions.
- Standardize date, currency, category, and location formats across every source.
- Filter unnecessary historical records before loading data into Power BI.
- Remove unused columns to reduce model size and refresh time.
- Document important transformation rules so teams can review future changes.
- Move complex shared transformations into dataflows, SQL views, or managed pipelines.
Design a Governed Power BI Semantic Model
The semantic model turns prepared data into business-ready information. It should provide consistent relationships, calculations, and definitions for every report connected to it.
Use a Clear Star Schema
Fact tables should contain measurable business activities such as sales, orders, payments, or support cases. Dimension tables should describe dates, customers, products, employees, and locations. This structure makes filters easier to understand and process.
Create Approved Business Measures
Measures should represent agreed definitions for revenue, margin, retention, headcount, and other important metrics. Business owners should approve these definitions before the model becomes widely available. Developers should avoid creating several measures that calculate the same result differently.
Separate Reusable Models from Reports
A shared semantic model can support several reports without repeating data preparation. This approach gives departments flexibility while keeping core calculations consistent. It also reduces model duplication across workspaces.
Apply Security and Governance Across Every Layer
Security should begin at the data source and continue through models, workspaces, reports, and apps. Governance rules must also define ownership, certification, publishing, and review responsibilities — the same access thinking that governs a well-built CRM.
- Grant workspace access through approved security groups whenever possible.
- Use row-level security to limit which records each user can view.
- Restrict Build permission for models containing sensitive or confidential data.
- Assign business and technical owners to every production semantic model.
- Certify trusted content that follows approved reporting and governance standards.
- Review guest access, sharing links, and inactive users on a regular schedule.
Build Report Pages for Clear Business Decisions
Report architecture should guide users from a high-level result to the details behind it. Each page needs a clear purpose rather than a collection of unrelated charts. Visuals should answer specific questions without forcing users to interpret unnecessary information.
Landing pages can present major performance indicators and important trends. Supporting pages can explain changes by product, location, customer group, or time period. Drill-through pages can provide detail without making the main report crowded.
Consistent layouts make reports easier to use across the organization. Filters, navigation buttons, titles, and metric labels should follow the same patterns. Users can then move between reports without learning a new interface each time.
Report designers should also consider performance during development. Every visual sends a query to the semantic model and requires time to render. Reducing unnecessary visuals can improve speed without reducing useful insight.
Large tables should not display thousands of records by default. Summary views can present the main result before users request deeper detail. This reduces initial query loads and makes pages easier to read.
Testing should include common user actions rather than only opening the report. Developers should test slicers, drill-through pages, bookmarks, and cross-filtering between visuals. These interactions may reveal performance problems that are hidden on the default page.
Design a Secure Architecture for HR Reporting
A Power BI HR dashboard may combine employee records, attendance, hiring data, turnover, performance information, and compensation details. Its architecture must provide useful workforce insights while protecting confidential employee data.
Separate Sensitive Data by Purpose
Not every HR user needs access to every employee field. Compensation, medical leave, disciplinary records, and personal identifiers may require separate models or stricter permissions. Reports should include only the data needed for their intended purpose.
Apply Role-Based Data Access
HR leaders may need company-wide results, while managers should see only their own teams. Row-level security can apply these limits through employee and reporting-line relationships. Security testing should confirm that users cannot reach restricted records through another report.
Create Approved Workforce Metrics
HR teams should define how the organization calculates headcount, turnover, absence, and time to hire. These rules should remain consistent across executive and departmental reports. Approved measures prevent leaders from receiving different workforce totals from separate dashboards.
Deploy, Monitor, and Maintain Power BI Content
Power BI architecture continues after a report reaches production. Teams need controlled deployment, active monitoring, and regular maintenance to keep reporting reliable.
- Separate development, testing, and production content across controlled workspaces.
- Use deployment pipelines to move approved changes between reporting environments.
- Monitor refresh history and investigate repeated failures before data becomes outdated.
- Track report usage to identify trusted, inactive, or duplicated content.
- Review model performance as data volume and user activity increase.
- Archive reports that have no owner, users, or remaining business purpose.
Conclusion
Power BI dashboard architecture connects raw data, technical processing, business logic, security, and report delivery. Every layer affects whether users receive fast, accurate, and trusted insights.
A strong architecture begins with reliable data sources and controlled transformation processes. It then uses shared semantic models, approved measures, and clear access rules to support consistent reporting.
Governance and monitoring keep the architecture useful after deployment, and the same is true of any custom software build. With clear ownership and regular reviews, Power BI can grow without creating report sprawl, security gaps, or conflicting business figures.
Put this into action with eSEOspace
We help businesses grow with website development that actually performs. Explore the services behind this guide:
Get a FREE Audit
We'll perform a comprehensive SEO, AEO, GEO & CRO audit of your website — completely free — and show you exactly how to outrank your competitors.
Don't have a site yet? Get in touch →
Get a FREE GEO/AEO/SEO Audit
We'll analyze your site's SEO, GEO, AEO & CRO — completely free — and show you exactly how to get found across Google and AI answers.
Don't have a site yet? Get in touch →
Great — your audit is on the way!
We'll send your free SEO/GEO/AEO/CRO audit within the next few hours. Where should we send it?
You're all set! ✓
Your free audit is being prepared — check your inbox in the next few hours. Talk soon!


On this page
- Understand the Complete Power BI Dashboard Architecture
- Build a Reliable Data Source and Ingestion Layer
- Clean and Prepare Data Before Modeling
- Design a Governed Power BI Semantic Model
- Apply Security and Governance Across Every Layer
- Build Report Pages for Clear Business Decisions
- Design a Secure Architecture for HR Reporting
- Deploy, Monitor, and Maintain Power BI Content
- Conclusion