
Menu

GEO, AEO & SEO Case Studies. Real results.

See how we've grown real businesses with SEO, GEO and AEO, with measurable wins in Google Search Console clicks, impressions and rankings.

We grow your business with

  1. CROturn traffic into leads
  2. SEOrank & get found
  3. GEOwin generative search
  4. AEOget cited by AI answers
  5. AIbuild a website that learns

Just launched

New sites, first weeks live

Just launched · Oct 2026

JupiDoor

Flat-Fee Real Estate · Utah & Idaho

3.2×

Weekly Google Impressions in the First Four Weeks

308 → 975 impressions a week (6–12 Oct vs 27 Oct–2 Nov)

New site live 5 Oct 2026

FIRST FOUR WEEKS

  • 33.7 → 21.6Avg. PositionPage 4 → Page 3
  • 72 → 169Searches Showing the Siteweek 1 vs week 4
  • 13 → 24Searches in Top 10week 1 vs week 4
  • 5 → 12Weekly Clicksearly days, new pages still climbing
  • 91 pages showing in Google (from 78)
  • 7 searches in the top 3 (from 4)
  • 100% of clicks from the US

Weekly Google Impressions Since the Data Starts

  1. 3086 Oct
  2. 786+155%13 Oct
  3. 861+10%20 Oct
  4. 975+13%27 Oct

Data from Google Search Console, 6 Oct – 2 Nov 2026 (weeks starting on the date shown; the property reports from early October)

Just launched · Oct 2026

Hope Center for Behavior Change

ABA Therapy & Autism Services · Florida

+437%

More Google Clicks in the First Weeks After Launch

35 → 188 clicks (3-day totals, 19–21 Oct vs 26–28 Oct)

New site live 14 Oct 2026

FIRST TWO WEEKS

  • +439%Impressions1,827 → 9,850 (3 days)
  • 139 → 720Searches Showing the Site5× more in a week
  • 12.7 → 8.0Avg. PositionPage 2 → Page 1
  • 73 → 386Searches in Top 10in one week
  • 274 pages already showing in Google
  • 93% of clicks from the US
  • 125 searches in the top 3

Daily Google Clicks Since the Data Starts

  1. 1119 Oct
  2. 8−27%20 Oct
  3. 16+100%21 Oct
  4. 52+225%22 Oct
  5. 54+4%23 Oct
  6. 25−54%24 Oct
  7. 36+44%25 Oct
  8. 60+67%26 Oct
  9. 61+2%27 Oct
  10. 67+10%28 Oct

Data from Google Search Console, 19–28 Oct 2026 (the first days the property reports)

Just launched · Oct 2026

Locascio Wellness

Therapy, Psychiatry & Assessments · locwellness.com

2×

Google Impressions in Week Two vs. Week One

5,542 → 11,541 impressions a week

New site live 11 Oct 2026

FIRST TWO WEEKS

  • +91%Clicks43 → 82 a week
  • +108%Impressions5,542 → 11,541 a week
  • 788 → 1,234Searches Showing the Siteweek over week
  • 121 → 223Searches in Top 10week over week
  • 189 pages showing in Google (from 140)
  • Avg. position 30.8 → 27.3
  • 90% of clicks from the US

Daily Google Impressions Since the Data Starts

  1. 63215 Oct
  2. 665+5%16 Oct
  3. 442−34%17 Oct
  4. 629+42%18 Oct
  5. 848+35%19 Oct
  6. 1,152+36%20 Oct
  7. 1,174+2%21 Oct
  8. 1,202+2%22 Oct
  9. 1,122−7%23 Oct
  10. 1,016−9%24 Oct
  11. 1,744+72%25 Oct
  12. 2,169+24%26 Oct
  13. 2,251+4%27 Oct
  14. 2,037−10%28 Oct

Data from Google Search Console, 15–28 Oct 2026 (the first days the property reports)

Just launched · Oct 2026

Dr. John Shershow, MD

ADHD Care & Psychiatry · New York

4.8×

Weekly Google Impressions After Launch

830 a week before → 3,949 in the third week live

New site live 8 Oct 2026

BEFORE vs. AFTER LAUNCH

  • +121%Weekly Clicks24 → 53
  • +376%Weekly Impressions830 → 3,949
  • 40 → 237Pages in Google4 weeks before vs. 1 week after
  • 950Searches in One Weekvs. 524 in the 4 weeks before
  • Weekly average of the 4 weeks before launch vs. 22–28 Oct
  • 96% of clicks from the US
  • New pages still climbing into the rankings

Weekly Google Impressions

  1. 1,15120 Aug
  2. 1,220+6%27 Aug
  3. 1,209−1%3 Sep
  4. 866−28%10 Sep
  5. 569−34%17 Sep
  6. 928+63%24 Sep
  7. 956+3%1 Oct
  8. 779−19%8 Oct
  9. 1,159+49%15 Oct
  10. 3,949+241%22 Oct

Data from Google Search Console, 20 Aug – 28 Oct 2026 (weeks starting on the date shown)

Launched · Sep 2026

Tenant Advisory Group

Commercial Real Estate & Tenant Representation · Chicago

3.8×

More Google Clicks Two Months After Launch

83 → 313 clicks (28 days before launch vs the latest 28 days)

New site live 4 Sep 2026

BEFORE vs. AFTER LAUNCH

  • 2.4×Impressions21.9K → 51.7K
  • 27.3 → 13.5Avg. PositionPage 3 → Page 2
  • 209 → 1,030Searches in Top 10before launch vs now
  • 29 → 97Pages With Clicksbefore launch vs now
  • 282 searches in the top 3 (from 50)
  • Avg. position 5.7 for “commercial real estate brokers chicago”
  • 84 clicks in the same 28 days of 2025

Weekly Google Clicks

  1. 1711 Aug
  2. 28+65%18 Aug
  3. 18−36%25 Aug
  4. 20+11%1 Sep
  5. 20+0%8 Sep
  6. 36+80%15 Sep
  7. 27−25%22 Sep
  8. 23−15%29 Sep
  9. 28+22%6 Oct
  10. 95+239%13 Oct
  11. 94−1%20 Oct
  12. 96+2%27 Oct

Data from Google Search Console, 7 Aug – 2 Nov 2026 (weeks starting on the date shown; before = 7 Aug – 3 Sep, latest = 6 Oct – 2 Nov)

Case studies

Long-term results

Case Study · 15 months

DrLewis.com

Integrative Psychiatry · Dr. Beata Lewis

283×

More Google Clicks in 15 Months

From 77 to 21,798 clicks/month

Jul 2025 – Sep 2026

KEY RESULTS

  • 283×Click Growth77 → 21,798/mo
  • 54×Impression Growth34K → 1.87M/mo
  • 53.0 → 6.5Avg. PositionPage 6 → Page 1
  • 20,933+Searches in Top 10up from 72
  • 1,239 pages getting Google traffic (from 143)
  • 11,164+ searches ranking in the top 3
  • 48% of Sep 2026 clicks from the US

Monthly Organic Clicks

  1. 77Jul ’25
  2. 94+22%Aug ’25
  3. 152+62%Sep ’25
  4. 267+76%Oct ’25
  5. 366+37%Nov ’25
  6. 598+63%Dec ’25
  7. 1,176+97%Jan ’26
  8. 1,312+12%Feb ’26
  9. 2,423+85%Mar ’26
  10. 3,866+60%Apr ’26
  11. 5,334+38%May ’26
  12. 7,382+38%Jun ’26
  13. 13,033+77%Jul ’26
  14. 20,065+54%Aug ’26
  15. 21,798+9%Sep ’26

Data from Google Search Console, July 2025 to September 2026 (last full month)

Case Study · 15 months

DrSensory.com

Sensory Processing & Pediatric Therapy

63×

More Google Clicks in 15 Months

From 176 to 11,099 clicks/month

Jul 2025 – Sep 2026

KEY RESULTS

  • 63×Click Growth176 → 11,099/mo
  • 24×Impression Growth70K → 1.68M/mo
  • 54.5 → 8.9Avg. PositionPage 6 → Page 1
  • 18,675+Searches in Top 10up from 455
  • 5,182 pages getting Google traffic (from 414)
  • 12,905 clicks in the first 28 days of Oct 2026
  • 64% of Sep 2026 clicks from the US

Monthly Organic Clicks

  1. 176Jul ’25
  2. 206+17%Aug ’25
  3. 389+89%Sep ’25
  4. 756+94%Oct ’25
  5. 1,193+58%Nov ’25
  6. 1,640+37%Dec ’25
  7. 2,429+48%Jan ’26
  8. 2,889+19%Feb ’26
  9. 3,166+10%Mar ’26
  10. 2,743−13%Apr ’26
  11. 2,887+5%May ’26
  12. 2,096−27%Jun ’26
  13. 4,233+102%Jul ’26
  14. 6,091+44%Aug ’26
  15. 11,099+82%Sep ’26

Data from Google Search Console, July 2025 to September 2026 (last full month). The site moved to www.drsensory.com in July 2026; earlier months are from the old address.

Case Study · 15 months

AnesthesiaJobs.com

Anesthesia Job Board · CRNAs & Anesthesiologists

339×

More Google Clicks in 15 Months

From 18 to 6,109 clicks/month

Jul 2025 – Sep 2026

KEY RESULTS

  • 339×Click Growth18 → 6,109/mo
  • 614×Impression Growth678 → 416K/mo
  • 21.3 → 6.4Avg. PositionPage 3 → Page 1
  • 9,040Searches in Top 10up from 11
  • 10,597 pages getting Google traffic (from 86)
  • 6,740 clicks in the first 28 days of Oct 2026
  • 96% of clicks from the US

Monthly Organic Clicks

  1. 18Jul ’25
  2. 561+3017%Aug ’25
  3. 546−3%Sep ’25
  4. 241−56%Oct ’25
  5. 192−20%Nov ’25
  6. 357+86%Dec ’25
  7. 765+114%Jan ’26
  8. 588−23%Feb ’26
  9. 1,468+150%Mar ’26
  10. 1,353−8%Apr ’26
  11. 1,602+18%May ’26
  12. 1,903+19%Jun ’26
  13. 2,065+9%Jul ’26
  14. 2,844+38%Aug ’26
  15. 6,109+115%Sep ’26

Data from Google Search Console, July 2025 to September 2026 (last full month)

Case Study · 8 months

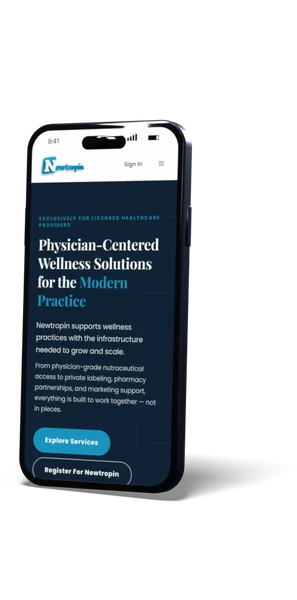
Newtropin.com

Peptide Therapy & Compounding Pharmacy

34×

More Google Clicks in 8 Months

From 315 to 10,686 clicks/month

Jan 2026 – Sep 2026

KEY RESULTS

  • 34×Click Growth315 → 10,686/mo
  • 72×Impression Growth9,098 → 654K/mo
  • 15 → 5,971Searches in Top 3Jan → Sep 2026
  • 14,529Searches in Top 10up from 83
  • #1–2 for “testagen peptide” and “best peptides for men”
  • 1,224 pages getting Google traffic (from 159)
  • 94% of clicks from the US

Monthly Organic Clicks

  1. 315Jan ’26
  2. 509+62%Feb ’26
  3. 1,202+136%Mar ’26
  4. 1,114−7%Apr ’26
  5. 2,016+81%May ’26
  6. 4,571+127%Jun ’26
  7. 8,355+83%Jul ’26
  8. 8,972+7%Aug ’26
  9. 10,686+19%Sep ’26

Data from Google Search Console, Jan 2026 – Sep 2026

Case Study · 14 months

Southwest Pain Management

Pain Management · Ventura & Los Angeles, CA

9.7×

More Google Clicks in 14 Months

From 152 to 1,478 clicks/month

Jul 2025 – Sep 2026

KEY RESULTS

  • 9.7×Click Growth152 → 1,478/mo
  • 9.5×Impression Growth14K → 137K/mo
  • 37.5 → 6.7Avg. PositionPage 4 → Page 1
  • 3,005Searches in Top 10up from 143
  • 223 pages getting Google traffic (from 28)
  • 1,616 searches ranking in the top 3
  • 93% of clicks from the US

Monthly Organic Clicks

  1. 152Jul ’25
  2. 146−4%Aug ’25
  3. 148+1%Sep ’25
  4. 173+17%Oct ’25
  5. 127−27%Nov ’25
  6. 135+6%Dec ’25
  7. 155+15%Jan ’26
  8. 147−5%Feb ’26
  9. 153+4%Mar ’26
  10. 163+7%Apr ’26
  11. 173+6%May ’26
  12. 216+25%Jun ’26
  13. 394+82%Jul ’26
  14. 690+75%Aug ’26
  15. 1,478+114%Sep ’26

Data from Google Search Console, Jul 2025 – Sep 2026

Case Study · 14 months

Shield Dental Care

Family & Implant Dentistry · Burke, VA

7.3×

More Google Clicks in 14 Months

From 137 to 995 clicks/month

Jul 2025 – Sep 2026

KEY RESULTS

  • 7.3×Click Growth137 → 995/mo
  • 12×Impression Growth14K → 157K/mo
  • 36.8 → 13.8Avg. PositionPage 4 → Page 2
  • 3,587Searches in Top 10up from 54
  • 408 pages getting Google traffic (from 70)
  • 1,509 searches ranking in the top 3
  • 82% of clicks from the US

Monthly Organic Clicks

  1. 137Jul ’25
  2. 127−7%Aug ’25
  3. 114−10%Sep ’25
  4. 134+18%Oct ’25
  5. 134+0%Nov ’25
  6. 148+10%Dec ’25
  7. 223+51%Jan ’26
  8. 275+23%Feb ’26
  9. 326+19%Mar ’26
  10. 435+33%Apr ’26
  11. 793+82%May ’26
  12. 567−28%Jun ’26
  13. 782+38%Jul ’26
  14. 704−10%Aug ’26
  15. 995+41%Sep ’26

Data from Google Search Console, Jul 2025 – Sep 2026

Case Study · 14 months

Mountainside Behavioral Health

DBT & CBT Therapy · Denver, CO

15×

More Google Clicks in 14 Months

From 22 clicks (Aug 2025) to 334 in the first 28 days of Oct 2026

Aug 2025 – Oct 2026

KEY RESULTS

  • 15×Click Growth22 → 334 a month
  • 118×Impression Growth302 → 36K a month
  • 46.8 → 19.1Avg. PositionPage 5 → Page 2
  • 1,007Searches in Top 10up from 1
  • 94 pages getting Google traffic (from 14)
  • 345 searches ranking in the top 3
  • 68% of clicks from the US

Monthly Organic Clicks

  1. 22Aug ’25
  2. 36+64%Sep ’25
  3. 68+89%Oct ’25
  4. 60−12%Nov ’25
  5. 92+53%Dec ’25
  6. 98+7%Jan ’26
  7. 83−15%Feb ’26
  8. 88+6%Mar ’26
  9. 84−5%Apr ’26
  10. 112+33%May ’26
  11. 109−3%Jun ’26
  12. 116+6%Jul ’26
  13. 101−13%Aug ’26
  14. 162+60%Sep ’26
  15. 334+106%Oct 1–28

Data from Google Search Console, Aug 2025 – Oct 2026 (October through the 28th)

Case Study · 3 months

Yak Management

Property Management · Bed-Stuy, Brooklyn

+72%

More Google Clicks per Month Since August

319 (Aug 2026) → 548 (Oct 2026)

Jul 2026 – Oct 2026

KEY RESULTS

  • +72%Monthly Clicks319 → 548
  • 1.5×Impressions35.5K → 53.5K a month
  • 15.4 → 10.7Avg. PositionAug → Oct
  • 329 → 627Searches in Top 10Aug → Oct
  • 138 searches in the top 3 (from 70)
  • Avg. position 7.6 for “CityFHEPS payment standards”
  • 95% of clicks from the US

Monthly Organic Clicks

  1. 89Jul 23–31
  2. 319Aug
  3. 470+47%Sep
  4. 548+17%Oct

Data from Google Search Console, 23 Jul – 31 Oct 2026 (the property reports from 23 July, so July is a partial month)

Case Study

Vein & Vascular Practice

Manhattan, NYC

+1,011%

Organic Traffic Growth in Just 6 Months

From 155 to 1,722 clicks/month

Dec 2025 – May 2026

Key Results

  • +1,011%Organic Click Growth155 → 1,722/mo
  • +1,256%Search Impressions15K → 204K/mo
  • 1,420GAE Cluster Clicks136 pages ranking
  • 171Pages Driving Trafficup from ~40
  • 5 → 70+ clicks/day
  • 15K → 204K monthly impressions
  • 1,722 clicks in May 2026

Month-Over-Month Organic Traffic Growth

  1. 155Dec
  2. 289+86%Jan
  3. 418+45%Feb
  4. 827+98%Mar
  5. 1,263+53%Apr
  6. 1,722+36%May

Data from Google Search Console, December 2025 to May 2026

Case Study

YoungerMeMD.com

Peptide Therapy & Longevity Medicine

+3,500%

Organic Traffic Growth in Just 6 Months

From 76 to 2,736 clicks/month

Dec 2025 – Jun 2026

Key Results

  • +3,500%Organic Click Growth76 → 2,736/mo
  • +2,550%Search Impressions12K → 338K/mo
  • 34.7 → 9.2Avg Position ImprovementPage 4 → Page 1
  • #1National Ranking"Peptides for Energy"
  • 0 → 59 keywords in top 3
  • 338K monthly impressions
  • 2,736 clicks in May 2026

Month-Over-Month Organic Traffic Growth

  1. 76Dec
  2. 162+113%Jan
  3. 407+151%Feb
  4. 1,067+162%Mar
  5. 1,854+74%Apr
  6. 2,736+48%May
  7. 2,924+7%Jun

Data from Google Search Console, December 2025 to June 2026

Case Study

VPMG Property Management

Vancouver, WA

+410%

Organic Traffic Growth in 12 Months

From 543 to 2,768 clicks/month

Oct 2025 – Sep 2026

Key Results

  • +410%Organic Click Growth543 → 2,768/mo
  • +3,638%Search Impressions11.7K → 436K/mo
  • 13.8 → 6.6Avg Position ImprovementPage 2 → Page 1
  • 2,175Keywords in Top 3up from 53
  • 27 → 117 pages driving traffic
  • 436K monthly impressions
  • 14,630 clicks in 12 months

Month-Over-Month Organic Traffic Growth

  1. 543Oct
  2. 600+10%Nov
  3. 477-20%Dec
  4. 724+52%Jan
  5. 763+5%Feb
  6. 848+11%Mar
  7. 958+13%Apr
  8. 964+1%May
  9. 1,323+37%Jun
  10. 2,171+64%Jul
  11. 2,491+15%Aug
  12. 2,768+11%Sep

Data from Google Search Console, October 2025 to September 2026

Case Study

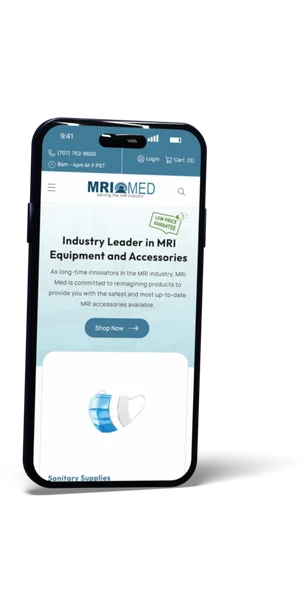
MRIMed.com

MRI Equipment & Supplies

+88%

Organic Traffic Growth in 7 Months

From 891 to 1,679 clicks/month

Nov 2025 – May 2026

Key Results

  • +88%Organic Click Growth891 → 1,679/mo
  • +151%Impression Growth58K → 146K/mo
  • 10.7 → 9.5Position ImprovementInto Page 1 Range
  • 3 → 15Keywords in Top 3+400% visibility
  • 108 blog posts & 753 products indexed
  • 100 AI-optimized FAQs deployed
  • $73.5K quarterly revenue · $657 AOV

Month-Over-Month Organic Clicks

  1. 891Nov
  2. 884-0.8%Dec
  3. 1,153+30%Jan
  4. 1,278+11%Feb
  5. 1,257-1.6%Mar
  6. 1,453+16%Apr
  7. 1,679+16%May

Data from Google Search Console, November 2025 to May 2026  ·  112 purchases · $73.5K quarterly revenue

CASE STUDY

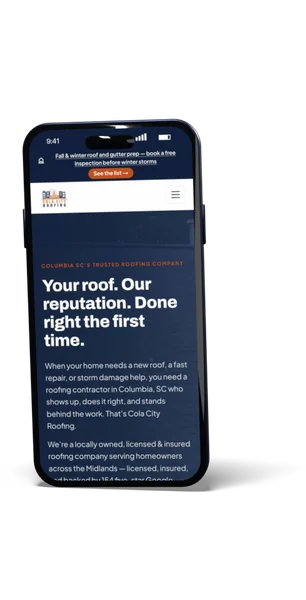
Cola City Roofing

Columbia, SC

+235%

Organic Traffic Growth in Just 6 Months

From 96 to 322 clicks/month

Dec 2025 – May 2026

KEY RESULTS

  • +235%ORGANIC CLICK GROWTH96 → 322/mo
  • +224%IMPRESSION GROWTH30K → 97K/mo
  • 24 → 17.7POSITION IMPROVEMENTPage 3 → Page 2
  • 32TOP 10 KEYWORDSup from 15
  • 3 → 10+ clicks/day
  • 30K → 97K monthly impressions
  • $2,500–$4,000/mo traffic value

Month-Over-Month Organic Traffic Growth

  1. 96Dec
  2. 113+18%Jan
  3. 121+7%Feb
  4. 242+100%Mar
  5. 226−7%Apr
  6. 322+42%May

Data from Google Search Console

Get a FREE Website Audit

Enter your website and get a 20–30 page SEO, GEO, AEO & CRO audit within 24 hours. Completely free.

Don't have a site yet? Get in touch →

Ready to speak with a marketing expert?
Give us a call! (916) 866-7893

Websites Launched
1407
Websites Launched
Marketing Experts
29
Marketing Experts
Hours of Dedicated Work
204533
Hours of Dedicated Work
Irina S.Benjamin G.Jeanette M.David G.