
This guide is part of our Shopify resource hub: plans and fees, setup, every major feature, apps, marketing, operations, comparisons and migrations.
Most teams treat launch day as the finish line. The store is live, orders trickle in, and somebody finally gets to switch off the old Magento admin (after one last backup, of course). But a working store and a better store aren’t the same thing. The second one takes months to prove.
Google is part of the reason. After a site move it has to recrawl and re-index every URL, and on a big catalog that’s slow going. Customers are the other part. A person who buys running socks twice a year isn’t coming back in March just because the product pages got prettier.
So the first job happens before launch: record where the old store stood. Pull a year of sessions by landing page, conversion rate by device, average order value, Core Web Vitals and support ticket counts. Then save the export with a date on it. A Shopify migration service typically covers data transfer, 301 redirect mapping, and theme rebuilds, and its pre-launch audit holds most of the baseline figures needed later. Teams running the move in-house will need to gather the same figures by hand.
The rest of this piece walks through which numbers matter in which month. Treat it as a rough guide. A shop with 200 SKUs moves through it faster than a brand juggling 40,000 products and a wholesale portal on the side.
Why Give It Six Months?
Week two lies a lot. A launch email can make sales look great for a few days while organic traffic sags because half the redirects haven’t been picked up yet, and anyone reading only one of those charts will walk away with the wrong idea.
Google’s own guide on site moves says a medium-sized site can expect most pages to move within a few weeks; bigger ones take longer. Then there’s the buying cycle. Coffee subscribers might reorder every five weeks. Skincare buyers, more like every two months. Repeat-order patterns simply won’t show before month three, no matter how hard anyone stares at the dashboard.
Season matters as well. October against September tells you almost nothing if October is always the busy month, so compare against the same month last year instead.
One cheap habit pays off here more than any fancy report: keep a change log. Launch date, theme edits, app installs, promos. A shared Google Sheet is fine, and GA4 annotations work too. Come month four, nobody will remember why conversion dipped on some random Tuesday. The log will.
Weeks One to Four: Is Anything Broken?
The first month is for catching breakage while it’s still cheap to fix. Most of the trouble lands in three places.
Redirects and 404s
Shopify’s URL structure is fixed: /products/, /collections/, /pages/, /blogs/. Old WooCommerce or BigCommerce URLs almost never line up with it, so every single one needs a 301. The ones that slip through don’t cause a crash. They just leak rankings, slowly, which is exactly why they get missed.
Screaming Frog in list mode handles the check well. Feed it every legacy URL and make sure each lands on the right page in one hop, because chains (A to B to C) waste crawl budget and shave off a little link equity at each step. Then keep an eye on the “Not found (404)” count in Search Console’s Pages report. It ought to drop week by week. When it creeps up instead, the usual suspect is a typo in the redirect file, and a missing trailing slash causes more of these than anyone would like to admit.
Checkout, Payments and Logins
Shopify’s checkout almost never breaks on its own. What breaks is everything bolted onto it: shipping zones, tax settings, discount rules, payment gateways, all rebuilt by hand during the move. Compare the share of sessions that reach checkout and actually convert with what the old platform managed. A sudden gap usually means some country lost its shipping rate, or a payment method quietly didn’t make the trip. Somebody should place real test orders with every method in week one (PayPal and buy-now-pay-later apps included). It’s boring. It’s also much cheaper than an angry customer email.
Logins are the other surprise. Passwords can’t be migrated, since old platforms store them as one-way hashes, so returning customers have to reactivate their accounts through an invite email. Watch the activation rate and tag every “can’t log in” ticket. Stores on Shopify’s newer customer accounts mostly skip this, because people sign in with a one-time code instead.
Months One to Three: Can Google Still Find You?
Organic traffic is where most migrations wobble. A small dip is normal; the real questions are how deep it goes and how fast it climbs back.
Indexing and Money Pages
Start with the indexed page count in Search Console and hold it up against the pre-launch figure. If it fell off a ledge, look for a template blocked in robots.txt, a noindex tag someone forgot to remove after staging, or redirects dumping whole categories on the homepage. It’s also worth spot-checking a few product URLs nested in collections, like /collections/shirts/products/blue-tee. The canonical tag there should point to the plain /products/ version. Ten minutes, tops.
Rankings come next, though tracking every keyword is a waste of an afternoon. Pick the 30 to 50 pages that brought in the most revenue on the old store and follow those weekly in Ahrefs or Semrush, with Search Console filling in the rest for free. If impressions hold but clicks slide, check titles and meta descriptions first. They get truncated or reset to theme defaults during import more often than you’d think.
Organic Revenue
Sessions only tell half the story. In GA4, filter to the Organic Search channel and look at revenue by landing page. Some stores lose a chunk of low-intent blog traffic after a move while their product pages earn more than ever; the traffic graph looks worse in the Monday meeting, and the bank balance looks better.
Where Does the Funnel Leak?
Conversion rate is the first number everyone asks about, and as one sitewide figure it hides almost everything useful. Mobile, desktop, paid, organic, first-time visitors and regulars all get mashed into a single percentage.
So split it. By device first, because a new theme can quietly help desktop while hurting mobile and the average barely flinches. Then by channel. If paid traffic suddenly converts worse while email and organic hold steady, the ad landing pages are the likely culprit, not the store.
Shopify Analytics breaks the funnel into steps: added to cart, reached checkout, converted. A drop in add-to-cart rate nearly always points at the product page. Missing variant photos, a size chart shoved below the fold, reviews that never got imported. Session recordings in Microsoft Clarity (free) or Hotjar make this painfully obvious, since you can literally watch shoppers scroll around looking for the button.
Average order value behaves differently. It slips when bundles, upsell blocks or free-shipping thresholds vanish during the move, and nobody notices until the monthly report. Shopify Bundles or an app like Rebuy can put them back. Someone just has to remember they were there.
How Fast Does the New Store Feel?
Google counts Core Web Vitals among its page experience signals, and the targets are public: Largest Contentful Paint under 2.5 seconds, Interaction to Next Paint under 200 milliseconds, Cumulative Layout Shift under 0.1.
For trends, the Web performance report in the Shopify admin is the better source because it draws on real visitors. PageSpeed Insights is handier for poking at one template, say a heavy collection page.
Most stores follow the same arc. They launch fast. Then app by app, script by script, things get heavier, and six months on the product page is a full second slower with nobody quite sure when it happened. A quarterly app clean-up keeps it in check and, as a side effect, usually trims the monthly bill.
Months Three to Six: Are Customers Coming Back?
Loyalty numbers move slowly. By the second quarter, though, there’s finally enough data to say something real about long-term health.
Repeat Purchases and Email Revenue
Compare cohorts, not totals: customers won in the first two months after launch against customers from the same months a year earlier. Shopify’s customer reports cover the basics, and Lifetimely or Peel go deeper if the store needs proper cohort charts.
When repeat purchases lag, check email before blaming the store. Integrations fail without a sound. A Klaviyo abandoned-cart flow that lost its trigger doesn’t throw an error; it just stops earning, and the gap only shows in the monthly numbers. Make sure post-purchase, win-back and replenishment flows still fire on the right Shopify events. And if the sending domain changed, inbox placement deserves a look too.
An Early Read on Lifetime Value
Six months is too short for true lifetime value. A 90-day or 180-day value per customer still points somewhere useful, and if newer cohorts outspend older ones over their first 180 days, that’s about as clear a sign as any that the move paid off.
The Numbers Nobody Puts in a Board Deck
Operational KPIs rarely get airtime upstairs. They should, because they tend to explain where margin disappeared to (or turned up from). A short list worth tracking:
- order processing time, purchase to shipment
- support tickets by topic, tagged in Gorgias or Zendesk
- manual hours replaced by Shopify Flow automations
- total monthly cost, counting plan fee, apps, transaction fees and developer time
That last one surprises people. Trade one big licence fee for fifteen small app subscriptions and the total can land right back where it started. Worth adding up once a quarter.
A Simple Six-Month Scorecard
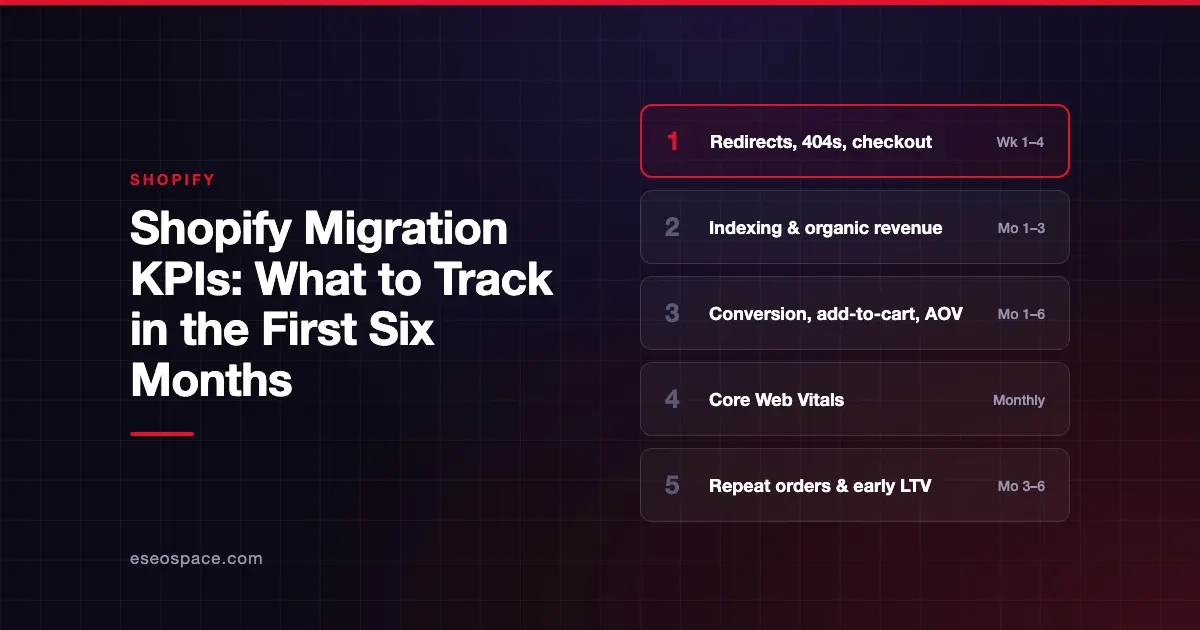
None of this needs a fancy BI tool. A shared sheet with one row per KPI, an owner and an acceptable range does the job. Something along these lines:
| KPI group | Main tools | When to watch closely |
|---|---|---|
| Redirects, 404s, checkout errors | Search Console, Screaming Frog, Shopify Analytics | Weeks 1 to 4 |
| Indexing, rankings, organic revenue | Search Console, Ahrefs or Semrush, GA4 | Months 1 to 3 |
| Conversion rate, add-to-cart, AOV | Shopify Analytics, GA4, Clarity or Hotjar | Months 1 to 6 |
| Core Web Vitals | Shopify Web performance report, PageSpeed Insights | Monthly, plus after new apps |
| Repeat purchases, flow revenue, early LTV | Shopify reports, Klaviyo, Lifetimely or Peel | Months 3 to 6 |
| Operations and cost | Helpdesk tags, Shopify Flow, billing records | Quarterly |
Ranges beat single targets. “Organic sessions within 10% of last year by month three” is something a team can act on; “traffic should recover” isn’t. Weekly reviews make sense in month one, then every other week until month three, then monthly. Traffic-light colors keep the meeting mercifully short.
Summing It Up
Nobody can call a migration a success on launch day. It earns that label over the following months, and the technical checks come first for a simple reason: they protect the rankings, conversions and repeat orders that get measured later.
Almost every figure here already lives in tools the team opens daily, whether that’s Search Console, GA4, Shopify Analytics or the email platform. What tends to be missing is a dated baseline and someone who actually looks. Sort out those two before launch, and by month six the question “was it worth it?” will have a straight answer.